Neon outline text reading 'Solutions Journalism Network' on a black background.

Storyboards

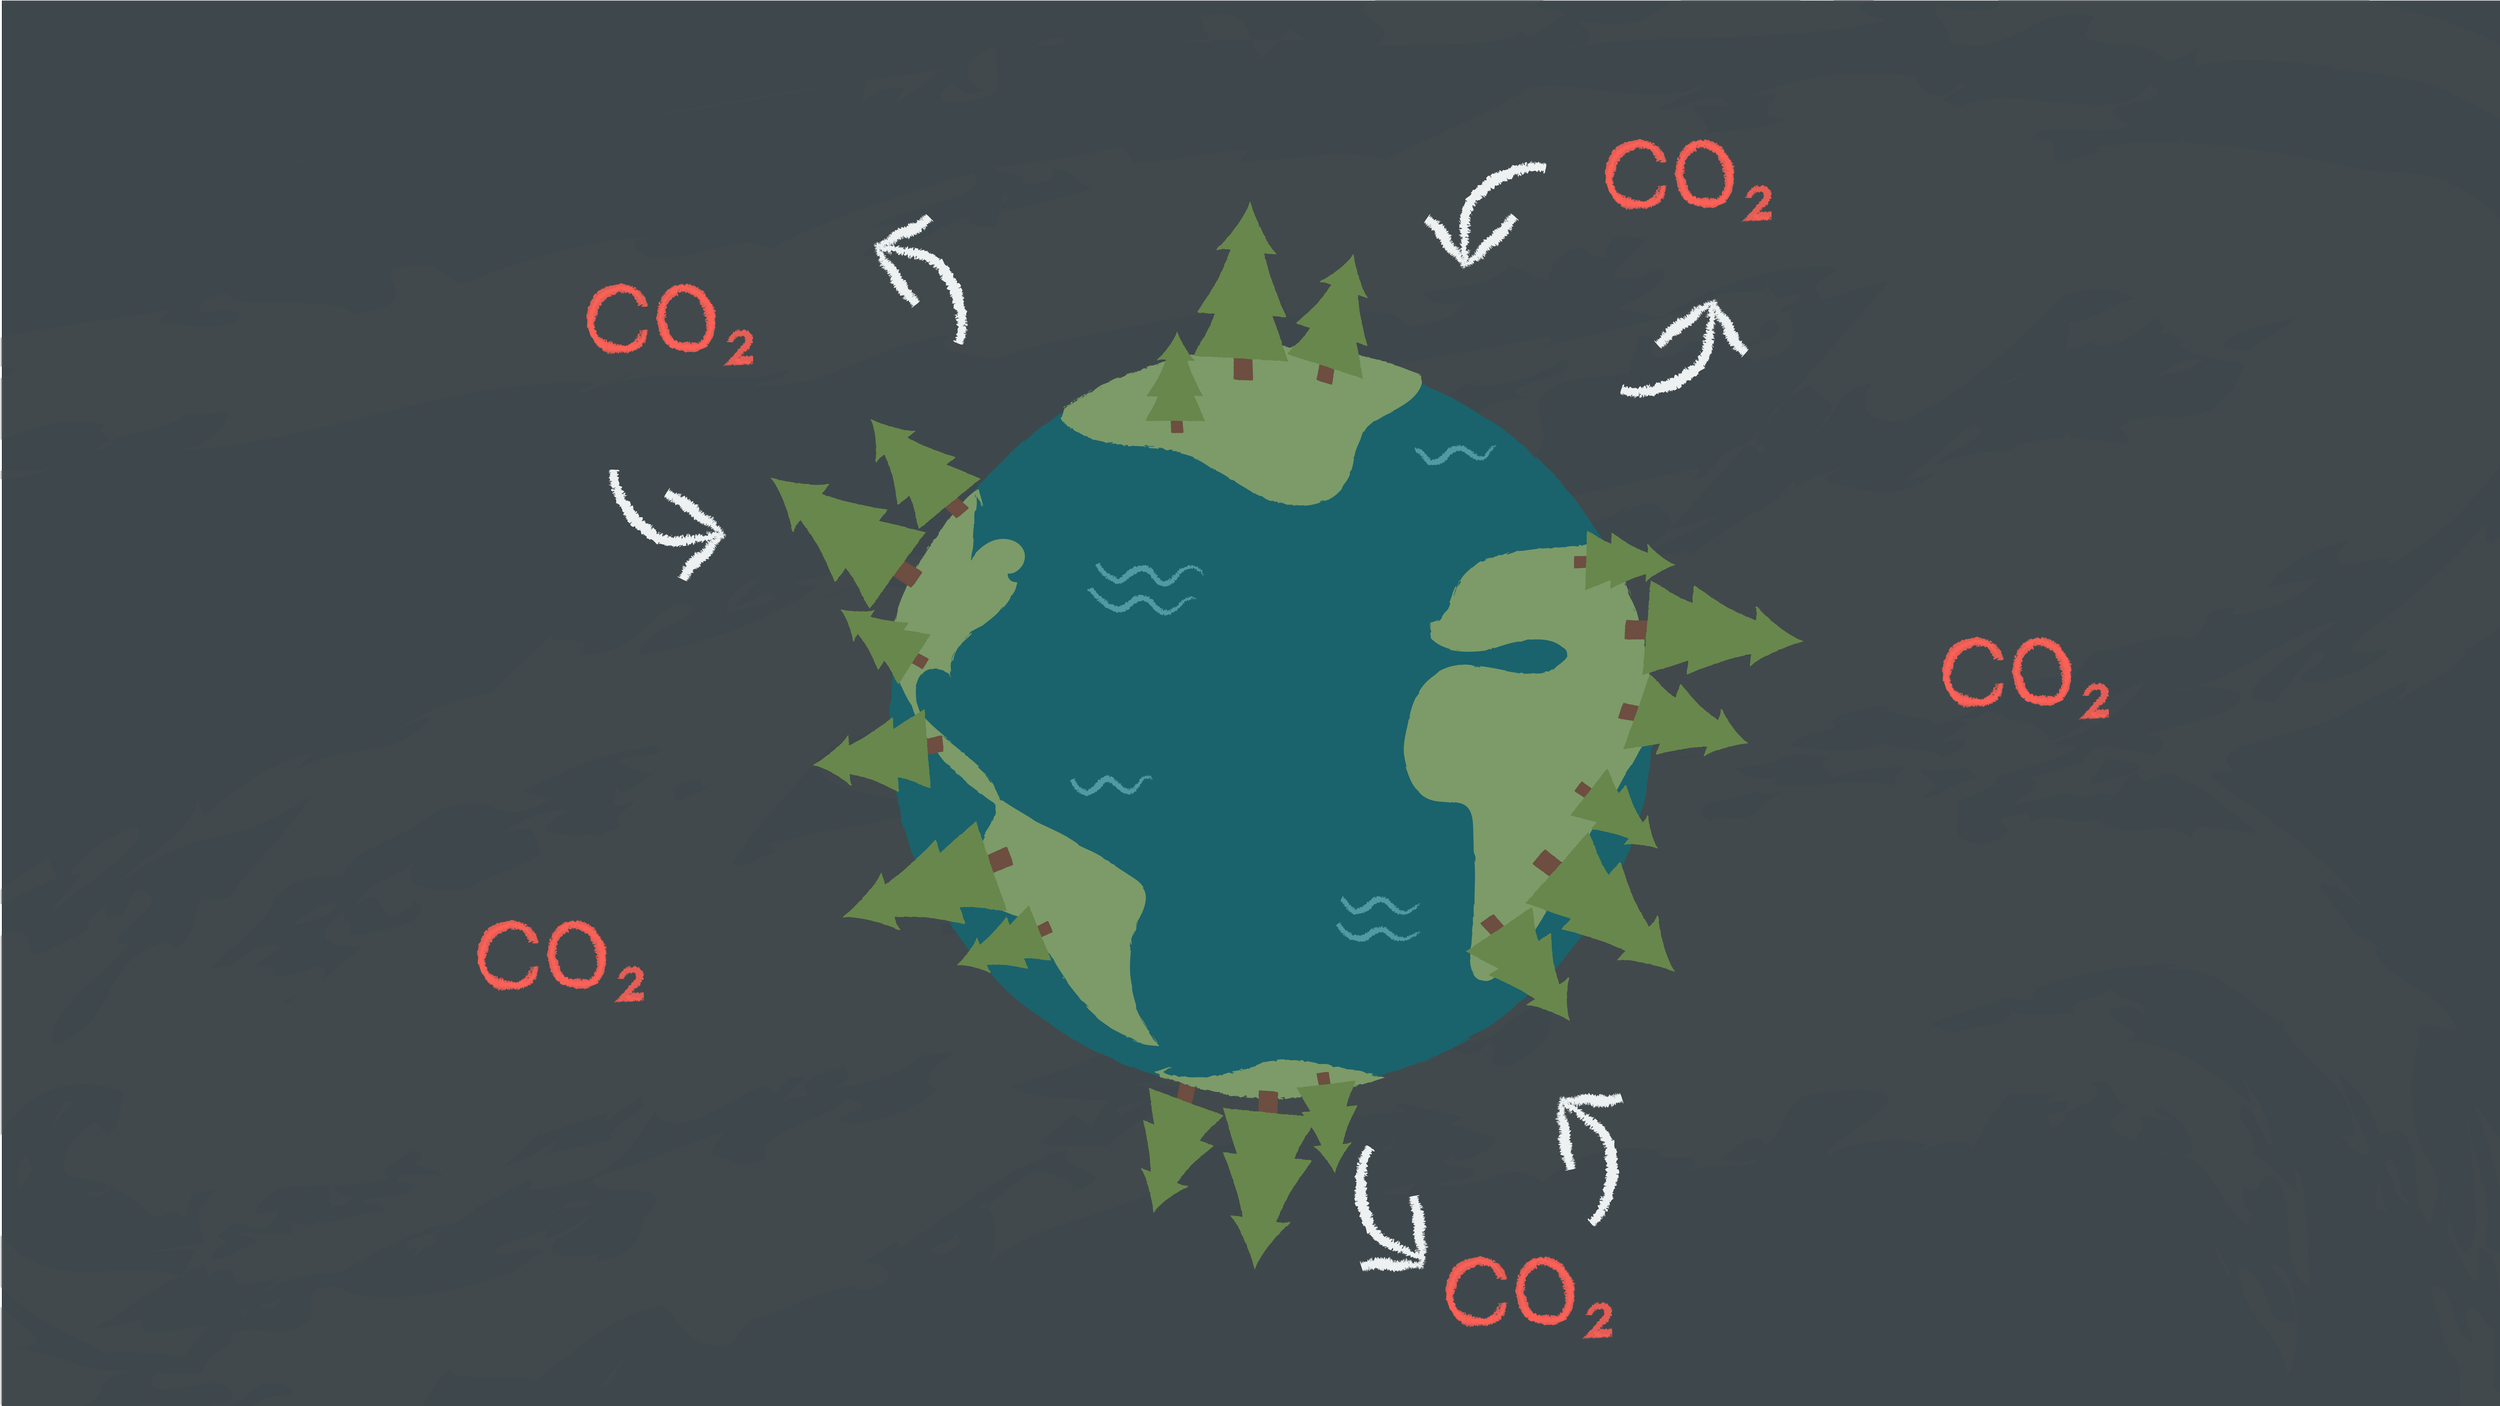
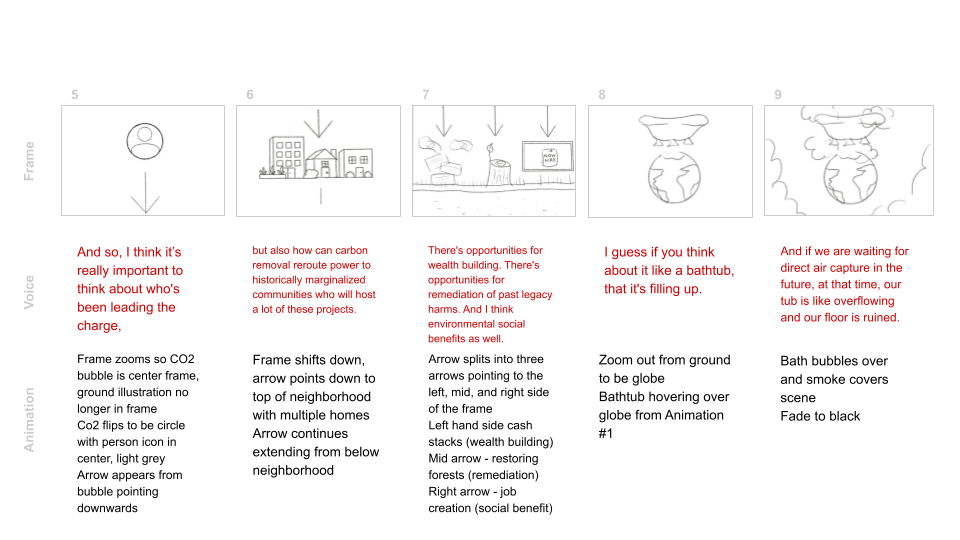
Abigail created educational animations by sketching storyboards and converting them into lively full-color illustrations. The illustrations were then animated and combined with voiceovers from scientists explaining the carbon removal process. The final result is an engaging and informative video that simplifies complex concepts through playful stylization and expert narration.

Animation Set #1

A four-step animation storyboard illustrating carbon dioxide removal and its environmental impact, including images of clouds, trees, factories, and pollution.
A series of sketches and annotations depicting environmental pollution and greenhouse gases. It shows a globe with factories emitting CO2, smoke, and pollution over forests and oceans, illustrating the impact of human activities on natural CO2 sinks and climate change.
Storyboard panels illustrating the concept of direct air capture (DAC) technology for carbon dioxide removal, showing Earth surrounded by CO2 molecules, bubbles representing air capture, and arrows depicting air flow and absorption process.
Infographic explaining carbon capture and storage, with diagrams showing carbon dioxide sources and storage methods.

Animation Set #2

A four-panel animated infographic about carbon dioxide and environmental impact. The first panel shows a balance scale representing power and political structures. The second panel depicts a bubble popping to illustrate CO2 reduction. The third panel illustrates land and factory emissions with trees and factories. The fourth panel features land with crops, a cow, and atmospheric elements, emphasizing land use and agriculture's role in carbon emissions.
A sequence of frames illustrating a conversation about environmental issues, including urban development, carbon footprint, climate change, and remediation projects, with accompanying voice narration and animations of globe and bubbles.

Animation Set #3

Four-panel animation showing the carbon cycle with text describing nature-based reductions, tropical forests and mangroves, and deforestation.
A four-panel frame showing a diagram about deforestation and emissions. Panel 1: A globe with trees and arrows indicating emissions, with accompanying text about deforestation's role in emissions. Panel 2: A globe with country flags and arrows representing major emitters like US, China, Indonesia, and Brazil. Panel 3: Countries Indonesia and Brazil with arrows circulating around trees, showing deforestation rates. Panel 4: A split ground and sky with a sign and the left side showing a chopped tree, illustrating logging operations.
Illustration of a step-by-step guide to planting trees, showing a tree trunk, soil mound with seedlings, and the growth process with accompanying text